Appendix
Appendix
Theme 1: Welcoming Environments
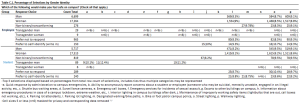
| Table. 1.1 | |||||
| My [gender identity or sexual orientation] is treated with respect by students / I am treated with respect by students [based on my race or ethnicity] (5-point scale; % agree + strongly agree) | Employee | Student | |||
| Demographic | Response Choice | Count | Percent | Count | Percent |
| Gender Identity | Man | 793 | 82.3% | 685 | 86.8% |
| Woman | 1,645 | 87.7% | 1,773 | 93.6% | |
| Non-binary/nonconforming | 24 | 80.0% | 59 | 59.0% | |
| Transgender man | 6 | 46.2% | |||
| Transgender woman | n<6 | – | n<6 | – | |
| Prefer not to respond | 86 | 63.7% | 33 | 67.3% | |
| Prefer to self-identify (write in) | 12 | 63.2% | 12 | 50.0% | |
| Race/Ethnicity | Asian/Asian American | 179 | 83.6% | 457 | 85.1% |
| Black/African American | 252 | 80.5% | 147 | 73.9% | |
| Hispanic/Latinx | 101 | 83.5% | 131 | 84.5% | |
| Middle Eastern or North African | 19 | 90.5% | 31 | 81.6% | |
| Native American/Alaska Native | 12 | 66.7% | n<6 | – | |
| Native Hawaiian/Pacific Islander | n<6 | – | n<6 | – | |
| White | 1,980 | 88.9% | 1,672 | 93.7% | |
| More than 1 | 140 | 82.4% | 275 | 83.6% | |
| Prefer not to respond | 199 | 71.6% | 74 | 82.2% | |
| Prefer to self-identify (write in) | 19 | 79.2% | 13 | 72.2% | |
| Sexual Orientation/Identity | Asexual | 35 | 68.6% | 46 | 62.2% |
| Bisexual | 100 | 72.5% | 272 | 81.4% | |
| Gay | 61 | 80.3% | 58 | 72.5% | |
| Heterosexual (straight) | 1,824 | 83.1% | 1,811 | 92.9% | |
| Lesbian | 40 | 75.5% | 54 | 79.4% | |
| Queer | 47 | 74.6% | 106 | 76.3% | |
| Questioning or unsure | 16 | 80.0% | 98 | 82.4% | |
| Prefer not to respond | 108 | 52.2% | 75 | 67.0% | |
| Prefer to self-identify (write in) | 17 | 73.9% | 28 | 71.8% | |
| Note. Cell sizes 5 or less (n<6) masked for privacy and corresponding data removed ‘-‘ | |||||
| Table. 1.2 | |||||
| UNC-Chapel Hill provides programming that fosters a welcoming and inclusive community (5-point scale; % agree + strongly agree) | Employee | Student | |||
| Demographic | Response Choice | Count | Percent | Count | Percent |
| Gender Identity | Man | 827 | 70.3% | 653 | 73.9% |
| Woman | 1,534 | 64.6% | 1,381 | 68.8% | |
| Non-binary/nonconforming | 24 | 57.1% | 44 | 44.9% | |
| Transgender man | n<6 | – | n<6 | – | |
| Transgender woman | n<6 | – | n<6 | – | |
| Prefer not to respond | 101 | 55.5% | 17 | 34.0% | |
| Prefer to self-identify (write in) | 16 | 61.5% | 12 | 46.2% | |
| Race/Ethnicity | Asian/Asian American | 155 | 70.1% | 368 | 71.5% |
| Black/African American | 184 | 50.7% | 97 | 51.3% | |
| Hispanic/Latinx | 80 | 57.6% | 96 | 63.2% | |
| Middle Eastern or North African | 14 | 63.6% | 21 | 55.3% | |
| Native American/Alaska Native | n<6 | – | n<6 | – | |
| Native Hawaiian/Pacific Islander | n<6 | – | n<6 | – | |
| White | 1,762 | 69.3% | 1,261 | 71.9% | |
| More than 1 | 115 | 62.8% | 209 | 64.3% | |
| Prefer not to respond | 173 | 57.9% | 50 | 59.5% | |
| Prefer to self-identify (write in) | 16 | 66.7% | 10 | 55.6% | |
| Sexual Orientation/Identity | Asexual | 51 | 62.2% | 52 | 66.7% |
| Bisexual | 110 | 59.5% | 197 | 56.8% | |
| Gay | 66 | 68.8% | 49 | 62.8% | |
| Heterosexual (straight) | 1,968 | 68.0% | 1,524 | 74.1% | |
| Lesbian | 42 | 61.8% | 41 | 61.2% | |
| Queer | 43 | 50.0% | 65 | 47.8% | |
| Questioning or unsure | 15 | 65.2% | 83 | 64.3% | |
| Prefer not to respond | 185 | 57.3% | 73 | 51.4% | |
| Prefer to self-identify (write in) | 18 | 50.0% | 28 | 65.1% | |
| Note. Cell sizes 5 or less (n<6) masked for privacy and corresponding data removed ‘-‘ | |||||
Theme 2: Interactions across Differences
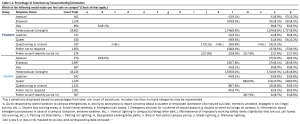
| Table 2.1 | |||||
| How well does UNC-Chapel Hill promote racial or cultural interaction between different groups? (4-point scale; % somewhat well + very well) | Employee | Student | |||
| Demographic | Response Choice | Count | Percent | Count | Percent |
| Gender Identity | Man | 765 | 72.0% | 645 | 78.5% |
| Woman | 1,484 | 68.4% | 1,422 | 73.0% | |
| Non-binary/nonconforming | 23 | 59.0% | 52 | 54.2% | |
| Transgender man | n<6 | – | 6 | 50.0% | |
| Transgender woman | n<6 | – | n<6 | – | |
| Prefer not to respond | 98 | 61.6% | 31 | 64.6% | |
| Prefer to self-identify (write in) | 16 | 66.7% | 14 | 53.8% | |
| Race/Ethnicity | Asian/Asian American | 139 | 67.8% | 363 | 72.7% |
| Black/African American | 201 | 59.8% | 112 | 60.9% | |
| Hispanic/Latinx | 89 | 67.9% | 109 | 73.6% | |
| Middle Eastern or North African | 10 | 50.0% | 21 | 61.8% | |
| Native American/Alaska Native | 8 | 47.1% | n<6 | – | |
| Native Hawaiian/Pacific Islander | n<6 | – | n<6 | – | |
| White | 1,649 | 71.5% | 1,277 | 76.5% | |
| More than 1 | 106 | 63.1% | 220 | 69.2% | |
| Prefer not to respond | 170 | 65.9% | 54 | 67.5% | |
| Prefer to self-identify (write in) | 18 | 72.0% | 11 | 64.7% | |
| Sexual Orientation/Identity | Asexual | 53 | 68.8% | 57 | 79.2% |
| Bisexual | 105 | 61.0% | 220 | 64.7% | |
| Gay | 59 | 67.8% | 50 | 70.4% | |
| Heterosexual (straight) | 1,869 | 71.3% | 1,526 | 77.5% | |
| Lesbian | 43 | 66.2% | 46 | 68.7% | |
| Queer | 37 | 45.7% | 73 | 54.1% | |
| Questioning or unsure | 11 | 50.0% | 87 | 68.0% | |
| Prefer not to respond | 182 | 64.3% | 82 | 65.1% | |
| Prefer to self-identify (write in) | 19 | 61.3% | 24 | 66.7% | |
| Note. Cell sizes 5 or less (n<6) masked for privacy and corresponding data removed ‘-‘ | |||||
Theme 3: Feelings of Safety
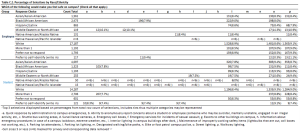
| Table 3.1 | |||||
| I feel safe on campus (5-point scale; % agree + strongly agree) | Employee | Student | |||
| Demographic | Response Choice | Count | Percent | Count | Percent |
| Gender Identity | Man | 1,052 | 88.0% | 770 | 86.9% |
| Woman | 1,865 | 78.7% | 1,434 | 71.3% | |
| Non-binary/nonconforming | 25 | 64.1% | 64 | 63.4% | |
| Transgender man | n<6 | – | 9 | 69.2% | |
| Transgender woman | n<6 | – | n<6 | – | |
| Prefer not to respond | 139 | 73.9% | 31 | 60.8% | |
| Prefer to self-identify (write in) | 14 | 56.0% | 18 | 69.2% | |
| Race/Ethnicity | Asian/Asian American | 181 | 80.8% | 391 | 74.1% |
| Black/African American | 268 | 74.7% | 116 | 62.7% | |
| Hispanic/Latinx | 99 | 71.2% | 104 | 68.0% | |
| Middle Eastern or North African | 18 | 78.3% | 27 | 73.0% | |
| Native American/Alaska Native | 16 | 80.0% | n<6 | – | |
| Native Hawaiian/Pacific Islander | n<6 | – | n<6 | – | |
| White | 2,147 | 84.3% | 1,388 | 79.0% | |
| More than 1 | 135 | 71.1% | 228 | 70.4% | |
| Prefer not to respond | 215 | 71.0% | 58 | 68.2% | |
| Prefer to self-identify (write in) | 19 | 76.0% | 13 | 81.2% | |
| Sexual Orientation/Identity | Asexual | 61 | 74.4% | 60 | 75.0% |
| Bisexual | 143 | 78.6% | 245 | 70.2% | |
| Gay | 84 | 88.4% | 63 | 80.8% | |
| Heterosexual (straight) | 2,403 | 82.7% | 1,603 | 78.0% | |
| Lesbian | 51 | 76.1% | 44 | 64.7% | |
| Queer | 62 | 72.1% | 101 | 72.7% | |
| Questioning or unsure | 16 | 69.6% | 93 | 69.9% | |
| Prefer not to respond | 241 | 73.7% | 85 | 61.6% | |
| Prefer to self-identify (write in) | 29 | 82.9% | 28 | 65.1% | |
| Note. Cell sizes 5 or less (n<6) masked for privacy and corresponding data removed ‘-‘ | |||||
| Table 3.2 | |||||
| I feel safe off campus (5-point scale; % agree + strongly agree) | Employee | Student | |||
| Demographic | Response Choice | Count | Percent | Count | Percent |
| Gender Identity | Man | 958 | 81.0% | 570 | 64.0% |
| Woman | 1,741 | 73.6% | 847 | 42.1% | |
| Non-binary/nonconforming | 25 | 61.0% | 45 | 44.6% | |
| Transgender man | n<6 | – | n<6 | – | |
| Transgender woman | n<6 | – | n<6 | – | |
| Prefer not to respond | 122 | 65.9% | 18 | 35.3% | |
| Prefer to self-identify (write in) | 13 | 52.0% | 12 | 46.2% | |
| Race/Ethnicity | Asian/Asian American | 135 | 62.5% | 219 | 41.6% |
| Black/African American | 262 | 73.2% | 81 | 44.8% | |
| Hispanic/Latinx | 94 | 68.1% | 77 | 50.3% | |
| Middle Eastern or North African | 15 | 68.2% | 16 | 44.4% | |
| Native American/Alaska Native | 13 | 72.2% | n<6 | – | |
| Native Hawaiian/Pacific Islander | n<6 | – | n<6 | – | |
| White | 2,002 | 78.7% | 913 | 51.8% | |
| More than 1 | 123 | 64.7% | 140 | 42.8% | |
| Prefer not to respond | 202 | 66.7% | 39 | 45.9% | |
| Prefer to self-identify (write in) | 19 | 73.1% | 9 | 50.0% | |
| Sexual Orientation/Identity | Asexual | 49 | 60.5% | 35 | 44.3% |
| Bisexual | 118 | 65.2% | 152 | 43.1% | |
| Gay | 72 | 77.4% | 37 | 48.1% | |
| Heterosexual (straight) | 2,248 | 77.6% | 1,067 | 51.8% | |
| Lesbian | 48 | 71.6% | 29 | 43.3% | |
| Queer | 61 | 70.9% | 65 | 46.8% | |
| Questioning or unsure | 15 | 68.2% | 47 | 35.9% | |
| Prefer not to respond | 216 | 66.5% | 46 | 33.1% | |
| Prefer to self-identify (write in) | 27 | 79.4% | 15 | 34.9% | |
| Note. Cell sizes 5 or less (n<6) masked for privacy and corresponding data removed ‘-‘ | |||||
Theme 4: Perceptions of Diversity & Inclusion
| Table 4.1 | |||||
| UNC-Chapel Hill is diverse (5-point scale; % agree + strongly agree) | Employee | Student | |||
| Demographic | Response Choice | Count | Percent | Count | Percent |
| Gender Identity | Man | 905 | 74.2% | 702 | 77.7% |
| Woman | 1,617 | 65.9% | 1,365 | 66.4% | |
| Non-binary/nonconforming | 28 | 66.7% | 48 | 47.1% | |
| Transgender man | n<6 | – | 8 | 61.5% | |
| Transgender woman | n<6 | – | n<6 | – | |
| Prefer not to respond | 108 | 58.4% | 28 | 54.9% | |
| Prefer to self-identify (write in) | 20 | 74.1% | 14 | 50.0% | |
| Race/Ethnicity | Asian/Asian American | 163 | 70.6% | 381 | 72.6% |
| Black/African American | 192 | 51.5% | 86 | 44.3% | |
| Hispanic/Latinx | 88 | 61.5% | 76 | 49.4% | |
| Middle Eastern or North African | 12 | 57.1% | 19 | 50.0% | |
| Native American/Alaska Native | 9 | 47.4% | n<6 | – | |
| Native Hawaiian/Pacific Islander | n<6 | – | n<6 | – | |
| White | 1,876 | 71.4% | 1,318 | 73.2% | |
| More than 1 | 120 | 63.2% | 211 | 63.6% | |
| Prefer not to respond | 203 | 66.8% | 55 | 63.2% | |
| Prefer to self-identify (write in) | 17 | 65.4% | 14 | 73.7% | |
| Sexual Orientation/Identity | Asexual | 64 | 75.3% | 51 | 64.6% |
| Bisexual | 113 | 60.4% | 199 | 55.3% | |
| Gay | 71 | 73.2% | 60 | 75.9% | |
| Heterosexual (straight) | 2,102 | 70.1% | 1,551 | 73.5% | |
| Lesbian | 38 | 55.9% | 37 | 55.2% | |
| Queer | 43 | 48.9% | 73 | 52.5% | |
| Questioning or unsure | 13 | 54.2% | 79 | 60.3% | |
| Prefer not to respond | 211 | 63.9% | 87 | 61.3% | |
| Prefer to self-identify (write in) | 18 | 50.0% | 26 | 57.8% | |
| Note. Cell sizes 5 or less (n<6) masked for privacy and corresponding data removed ‘-‘ | |||||
| Table 4.2 | |||||
| UNC-Chapel Hill is inclusive (5-point scale; % agree + strongly agree) | Employee | Student | |||
| Demographic | Response Choice | Count | Percent | Count | Percent |
| Gender Identity | Man | 830 | 68.6% | 677 | 74.8% |
| Woman | 1,419 | 58.4% | 1,319 | 64.2% | |
| Non-binary/nonconforming | 23 | 54.8% | 44 | 43.1% | |
| Transgender man | n<6 | – | n<6 | – | |
| Transgender woman | n<6 | – | n<6 | – | |
| Prefer not to respond | 91 | 50.0% | 21 | 41.2% | |
| Prefer to self-identify (write in) | 13 | 52.0% | 12 | 44.4% | |
| Race/Ethnicity | Asian/Asian American | 157 | 69.5% | 381 | 72.4% |
| Black/African American | 165 | 45.0% | 86 | 44.3% | |
| Hispanic/Latinx | 80 | 56.7% | 90 | 58.4% | |
| Middle Eastern or North African | 13 | 61.9% | 16 | 42.1% | |
| Native American/Alaska Native | 6 | 31.6% | n<6 | – | |
| Native Hawaiian/Pacific Islander | n<6 | – | n<6 | – | |
| White | 1,683 | 64.3% | 1,235 | 68.7% | |
| More than 1 | 105 | 56.8% | 208 | 62.7% | |
| Prefer not to respond | 152 | 50.7% | 50 | 57.5% | |
| Prefer to self-identify (write in) | 14 | 56.0% | 12 | 63.2% | |
| Sexual Orientation/Identity | Asexual | 52 | 61.2% | 49 | 60.5% |
| Bisexual | 96 | 51.3% | 203 | 56.7% | |
| Gay | 68 | 70.1% | 47 | 59.5% | |
| Heterosexual (straight) | 1,892 | 63.7% | 1,496 | 71.1% | |
| Lesbian | 30 | 44.1% | 40 | 59.7% | |
| Queer | 35 | 40.2% | 60 | 43.2% | |
| Questioning or unsure | 14 | 58.3% | 80 | 60.6% | |
| Prefer not to respond | 172 | 52.9% | 73 | 51.4% | |
| Prefer to self-identify (write in) | 18 | 50.0% | 27 | 60.0% | |
| Note. Cell sizes 5 or less (n<6) masked for privacy and corresponding data removed ‘-‘ | |||||
| Table 4.3 | |||||
| I would recommend UNC-Chapel Hill to others considering working/attending here (5-point scale; % agree + strongly agree) | Employee | Student | |||
| Demographic | Response Choice | Count | Percent | Count | Percent |
| Gender Identity | Man | 879 | 72.0% | 747 | 83.1% |
| Woman | 1,747 | 71.4% | 1,620 | 79.5% | |
| Non-binary/nonconforming | 24 | 57.1% | 57 | 57.0% | |
| Transgender man | n<6 | – | 6 | 46.2% | |
| Transgender woman | n<6 | – | n<6 | – | |
| Prefer not to respond | 94 | 50.8% | 30 | 58.8% | |
| Prefer to self-identify (write in) | 14 | 51.9% | 19 | 67.9% | |
| Race/Ethnicity | Asian/Asian American | 165 | 72.4% | 417 | 79.9% |
| Black/African American | 231 | 61.9% | 111 | 58.4% | |
| Hispanic/Latinx | 91 | 64.1% | 111 | 73.5% | |
| Middle Eastern or North African | 15 | 68.2% | 31 | 83.8% | |
| Native American/Alaska Native | 8 | 42.1% | n<6 | – | |
| Native Hawaiian/Pacific Islander | n<6 | – | n<6 | – | |
| White | 1,930 | 73.4% | 1,465 | 81.9% | |
| More than 1 | 129 | 67.9% | 263 | 80.2% | |
| Prefer not to respond | 173 | 56.9% | 60 | 69.0% | |
| Prefer to self-identify (write in) | 19 | 73.1% | 18 | 94.7% | |
| Sexual Orientation/Identity | Asexual | 58 | 67.4% | 55 | 69.6% |
| Bisexual | 122 | 65.6% | 262 | 73.8% | |
| Gay | 70 | 72.2% | 55 | 70.5% | |
| Heterosexual (straight) | 2,183 | 72.9% | 1,747 | 83.5% | |
| Lesbian | 45 | 66.2% | 50 | 74.6% | |
| Queer | 52 | 59.8% | 88 | 63.3% | |
| Questioning or unsure | 13 | 54.2% | 90 | 69.2% | |
| Prefer not to respond | 190 | 57.4% | 90 | 63.8% | |
| Prefer to self-identify (write in) | 20 | 55.6% | 38 | 86.4% | |
| Note. Cell sizes 5 or less (n<6) masked for privacy and corresponding data removed ‘-‘ | |||||