Perceptions of Diversity and Inclusion
Theme 4: Perceptions of Diversity and Inclusion
The campus community responded to questions about their perceptions of the overall experience at Carolina in terms of diversity, inclusion, and whether they would recommend that other individuals consider working at, or attending, the University.
- To what extent do you agree or disagree with the following statements about the overall experience at UNC–Chapel Hill? ( Strongly disagree, 2. Disagree, 3. Neutral, 4. Agree, 5. Strongly agree)
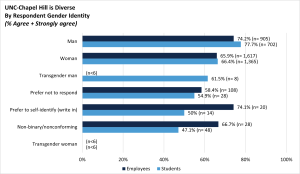
- UNC-Chapel Hill is diverse.
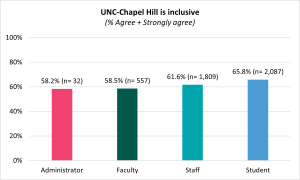
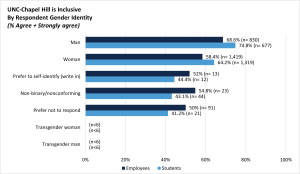
- UNC-Chapel Hill is inclusive.
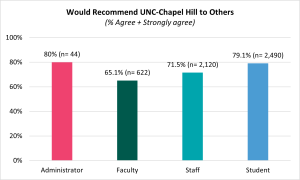
- I would recommend UNC-Chapel Hill to others considering working (or attending) here.
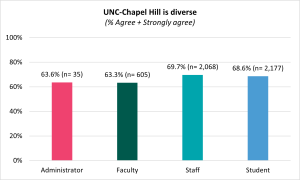
Over three-fifths of administrators (63.6%), faculty (63.3%), staff (69.7%), and students (68.6%) who participated in the survey agreed that UNC-Chapel Hill is diverse. Over half of administrators (58.2%), faculty (58.5%), staff (61.6%), and students (65.8%) agreed that the University is inclusive. Approximately four-fifths of administrators (80.0%) and students (79.1%) agreed that they would recommend the University to others to attend or work; most staff (71.5%) and faculty (65.1%) echoed these sentiments as well.
By Gender Identity
- Diversity: Employees who preferred not to report a gender identity agreed (58.4%) less than peers identifying as men (74.2%) that UNC-Chapel Hill is diverse. Students who identified as non-binary/nonconforming agreed (47.1%) less than students identifying as men (77.7%) that the University is diverse (see Appendix Table 4.1).
- Inclusiveness: Employees who preferred not to share their gender identity agreed (50.0%) less than peers identifying as men (68.6%) that UNC-Chapel Hill is inclusive. Students who preferred not to share their gender identity were less likely to agree (41.2%) that UNC-Chapel Hill is inclusive than their counterparts who identified as men (74.8%) (see Appendix Table 4.2).
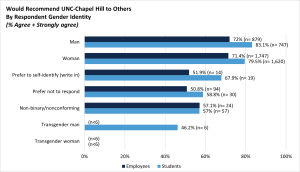
- Would Recommend UNC-Chapel Hill to Others: Employees who preferred not to report a gender identity were less likely to agree (50.8%) than peers identifying men (72.0%) that they would recommend UNC-Chapel Hill to others considering working here. Students who identified as transgender men were less likely to agree (46.2%) than peers identifying as men (83.1%) that they would recommend UNC-Chapel Hill to others considering attending here (see Appendix Table 4.3).
By Race/Ethnicity
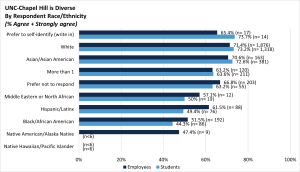
- Diversity: Employees identifying as Native American/Alaska Native were less likely to agree (47.4%) than those identifying as White (71.4%) that the University is diverse. Students identifying as Black/African American agreed (44.3%) less than peers who preferred to self-identify (write in a race/ethnicity) (73.7%) that UNC-Chapel Hill is diverse (see Appendix Table 4.1).
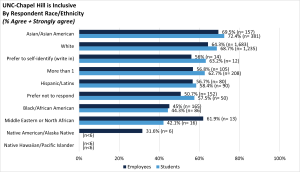
- Inclusiveness: Employees who identified as Native American/Alaska Native were less likely to agree (31.6%) than those identifying as Asian/Asian American (69.5%) that UNC-Chapel Hill is inclusive. Students identifying as Middle Eastern or North African were less likely to agree (42.1%) than counterparts identifying as Asian/Asian American (72.4%) that UNC-Chapel Hill is inclusive (see Appendix Table 4.2).
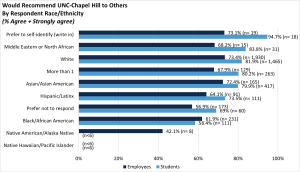
- Would Recommend UNC-Chapel Hill to Others: Employees who identified as Native American/Alaska Native were less likely to agree (42.1%) than those identifying as White (73.4%) that they would recommend UNC-Chapel Hill to others considering working here. Students identifying as Black/African American agreed less (58.4%) than peers who preferred to self-identify (write in a race or ethnicity) (94.7%) that they would recommend UNC-Chapel Hill to others considering attending here (see Appendix Table 4.3).
By Sexual Orientation/Identity
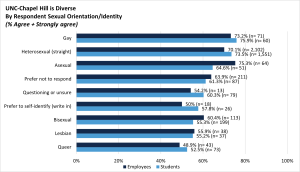
- Diversity: Employees identifying as queer agreed (48.9%) less than those identifying as gay (75.3%) that UNC-Chapel Hill is diverse. Similarly, students identifying as queer were less likely to agree (52.5%) than peers identifying as gay (75.9%) that UNC-Chapel Hill is diverse (see Appendix Table 4.1).
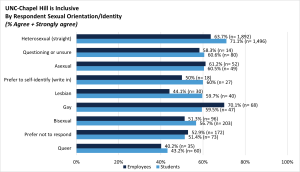
- Inclusiveness: Employees identifying as queer were less likely to agree (40.2%) than those who identified as gay (70.1%) that UNC-Chapel Hill is inclusive. Students identifying as queer agreed (43.2%) less than peers identifying as heterosexual (straight) (71.1%) that UNC-Chapel Hill is inclusive (see Appendix Table 4.2).
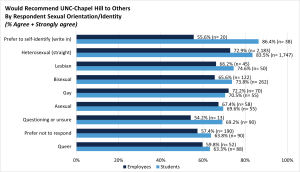
- Would Recommend UNC-Chapel Hill to Others: Employees identifying as questioning or unsure agreed (54.2%) less than peers identifying as heterosexual (straight) (72.9%) that they would recommend UNC-Chapel Hill to others considering working here. Students identifying as queer agreed (63.3%) less than peers who preferred to self-identify (write in a sexual orientation or identity) (86.4%) that they would recommend UNC-Chapel Hill to others considering attending here (see Appendix Table 4.3).