Interactions Across Differences
Theme 2: Interactions across Differences
Interacting with others is an integral part of the University experience as it offers the opportunity to gain new insights around a variety of topics. To gauge such experiences, individuals were asked the following question:
- How well does UNC-Chapel Hill promote racial or cultural interaction between different groups? (1. Not at all, 2. Not very well, 3. Somewhat well, 4. Very well)
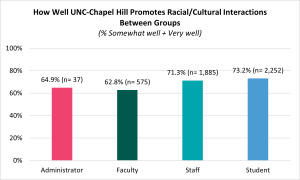
Over half of administrators (64.9%), faculty (62.8%), staff (71.3%), and students (73.2%) who participated in the survey believed the institution promoted racial or cultural interactions between different groups well.
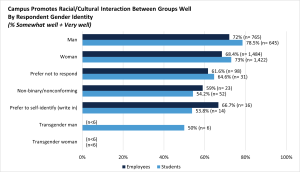
By Gender Identity
- Employees identifying as non-binary/nonconforming were less likely to indicate (59.0%) than peers identifying as men (78.5%) that UNC-Chapel Hill is doing well promoting racial or cultural interactions between different groups. Similarly, students identifying as transgender men were less likely to indicate (50.0%) than students identifying as men (78.5%) that the University is doing well promoting interactions (see Appendix Table 2.1).
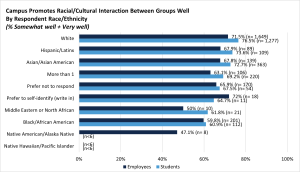
By Race/Ethnicity
- Employees identifying as Native American/Alaska Native were less likely to indicate (47.1%) than peers who preferred to self-identify (write in a race or ethnicity) (72.0%) that UNC-Chapel Hill is doing well promoting racial or cultural interactions between different groups. Students identifying as Black/African American were less likely to indicate (60.9%) than peers identifying as White (76.5%) that the University is doing well promoting interactions (see Appendix Table 2.1).
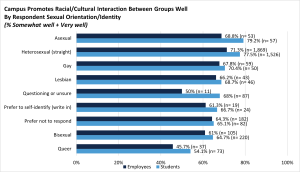
By Sexual Orientation/Identity
- Employees identifying as queer indicated (45.7%) less than peers identifying as heterosexual (straight) (71.3%) that UNC-Chapel Hill is doing well promoting racial or cultural interactions between different groups. Similarly, students identifying as queer indicated (54.1%) less than students identifying as heterosexual straight (77.5%) that the University is doing well promoting interactions (see Appendix Table 2.1).