Welcoming Environments
Theme 1: Welcoming Environments
Participating Carolina community members shared their perceptions of the environment at the University by responding to the following two questions.
- To what extent do you agree or disagree with the following statements? (1. Strongly disagree, 2. Disagree, 3. Neutral, 4. Agree, 5. Strongly agree)
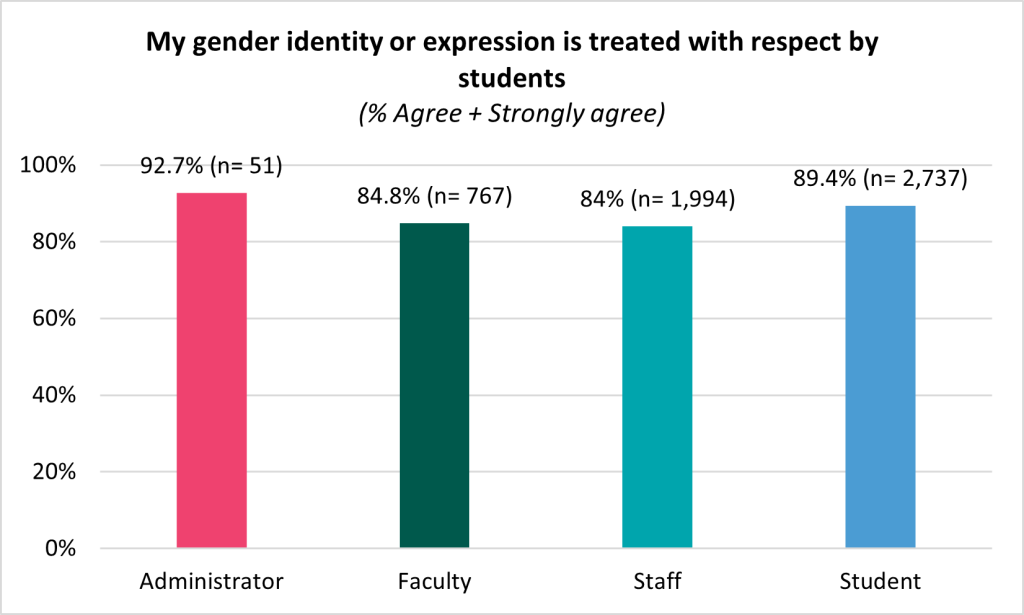
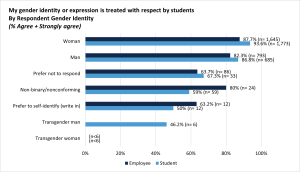
- My gender identity or expression is treated with respect by students.
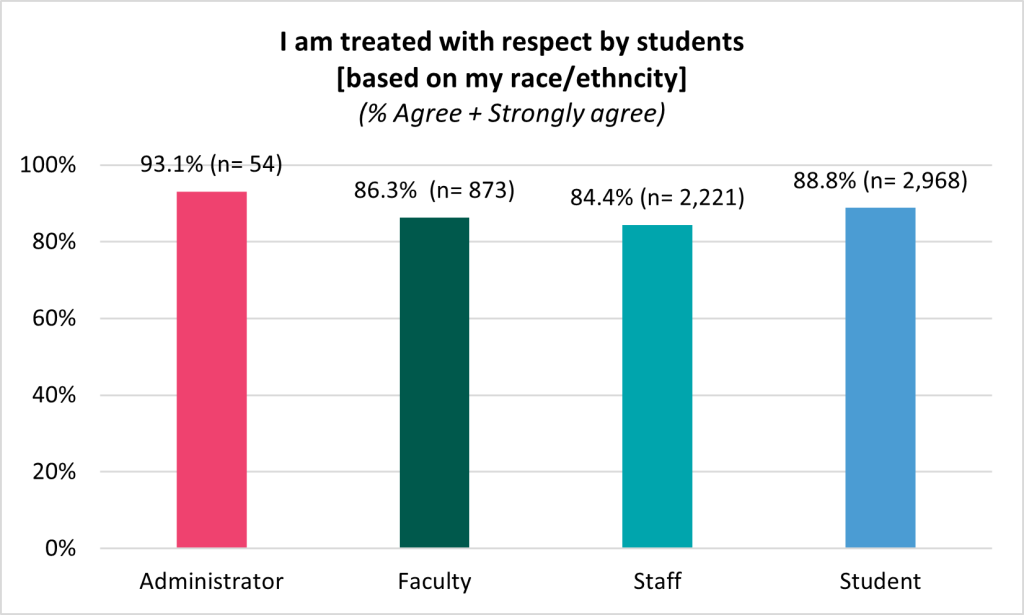
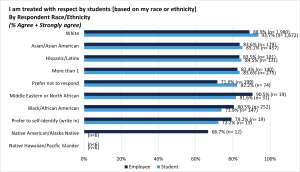
- I am treated with respect by students [based on my race or ethnicity].
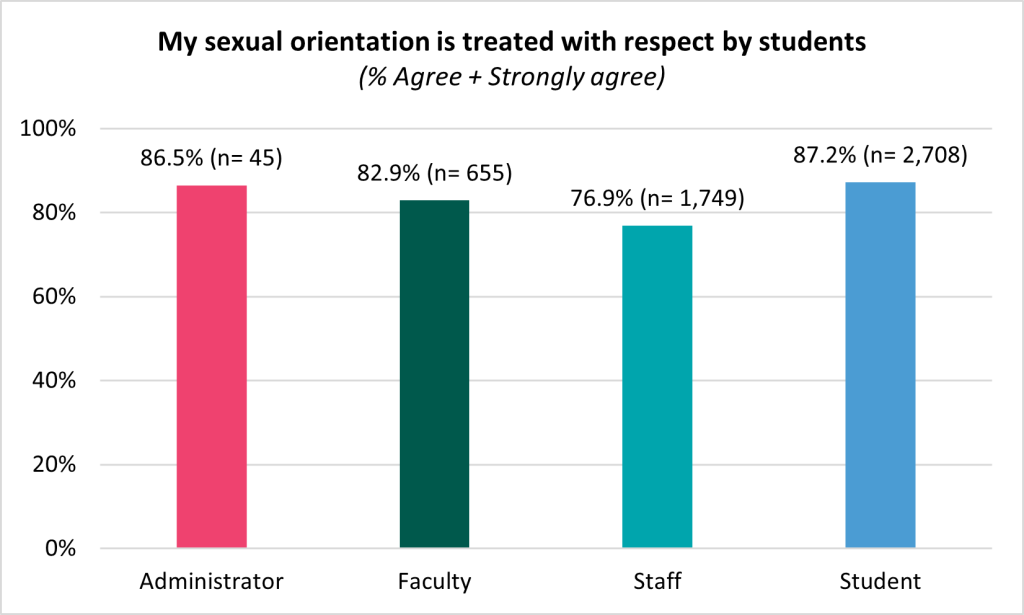
- My sexual orientation is treated with respect by students.
- To what extent do you agree or disagree with the following statements about the overall experience at UNC–Chapel Hill? (1. Strongly disagree, 2. Disagree, 3. Neutral, 4. Agree, 5. Strongly agree)
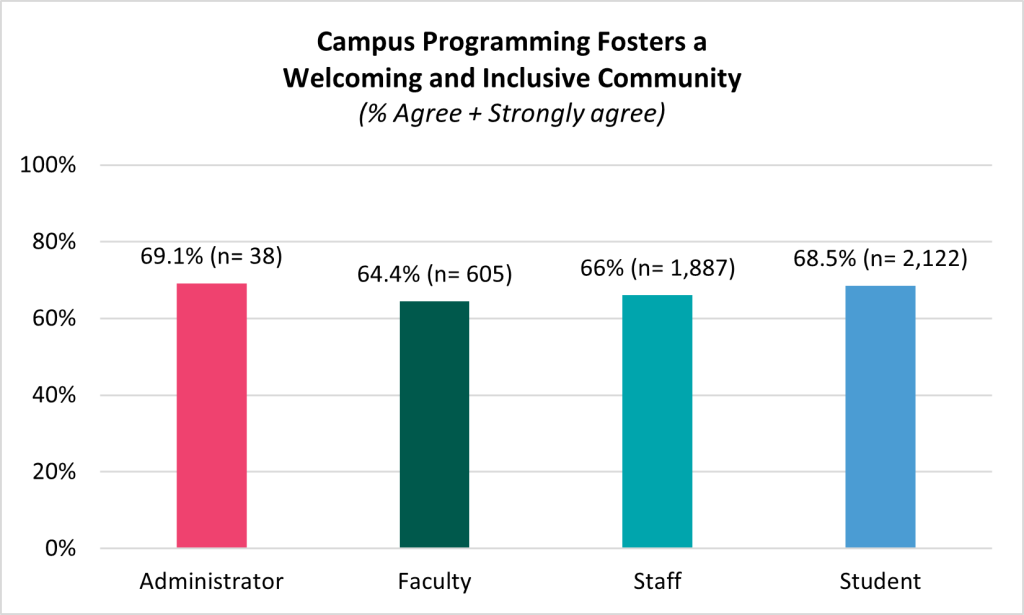
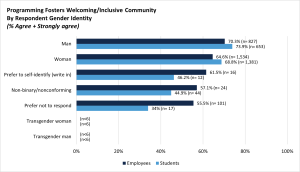
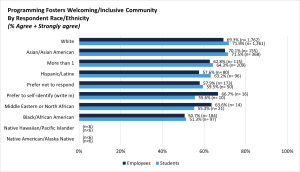
- UNC-Chapel Hill provides programming that fosters a welcoming and inclusive community.
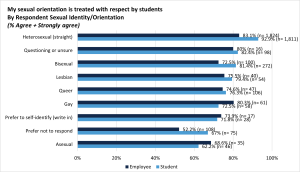
Over four-fifths of administrators (92.7%), faculty (84.8%), staff (84.0%), and students (89.4%) agreed or strongly agreed that their gender identity or expression is treated with respect by students. Similarly, over four-fifths of administrators (93.1%), faculty (86.3%), staff (84.4%), and students (88.8%) agreed or strongly agreed that they are treated with respect by students based on their race or ethnicity. Lastly, over four-fifths of administrators (86.5%), faculty (82.9%), and students (87.2%) agreed or strongly agreed that their sexual orientation is treated with respect by students, with staff (76.9%) agreeing slightly less than their peers.
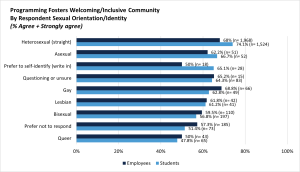
About two-thirds of administrators (69.1%), staff (66.0%), and students (68.5%) agreed or strongly agreed that UNC-Chapel Hill provided programming that fosters a welcoming and inclusive community with faculty (64.4%) agreeing slightly less.
By Gender Identity
- Respect: Employees who preferred to self-identify (write in a gender identity) agreed (63.2%) less than peers identifying as women (87.7%) that their gender identity or expression is treated with respect by students. Students who identified as transgender men agreed (46.2%) less than those identifying as women (93.6%) that their gender identity or expression is treated with respect by students (see Appendix Table 1.1).
- Programming: Employees who preferred not to respond their gender identity were less likely to agree (55.5%) that the University provides programming that fosters a welcoming and inclusive community than those who identified as men (70.3%). Similarly, students who preferred not to share their gender identity agreed (34.0%) less than students identifying as men (73.9%) about programming (see Appendix Table 1.2).
By Race/Ethnicity
- Respect: Employees who identified as Native American/Alaska Native were less likely to agree (66.7%) that they are treated with respect by students (based on their race or ethnicity) than their Middle Eastern or North African (90.5%) peers. Students who preferred to self-identify (write in a race or ethnicity) agreed less (72.2%) than their White (93.7%) peers that they are treated with respect by students (based on their race or ethnicity) (see Appendix Table 1.1).
- Programming: Employees identifying as Black/African American were less likely to agree (50.7%) than peers identifying as Asian/Asian American (70.1%) that UNC-Chapel Hill provides programming that fosters a welcoming and inclusive community. Students identifying as Black/African American were less likely to agree (51.3%) about programming than peers identifying as White (71.9%) (see Appendix Table 1.2).
By Sexual Orientation/Identity
- Respect: Employees who preferred not to respond about their sexual orientation/identity agreed (52.2%) less than peers identifying as heterosexual (straight) (83.1%) that their sexual orientation is treated with respect by students. Students identifying as asexual were also less likely to agree (62.2%) than peers identifying as heterosexual (straight) (92.9%) (see Appendix Table 1.1).
- Programming: Employees identifying as queer and those who preferred not to share their sexual orientation/identity were less likely to agree (50.0%) than peers identifying as gay (68.8%) that UNC-Chapel Hill provides programming fostering a welcoming and inclusive community. Similarly, students identifying as queer agreed (47.8%) less than their peers identifying as heterosexual (straight) (74.1%) (see Appendix Table 1.2).